|
|
 发表于 2024-4-28 23:01:29
|
显示全部楼层
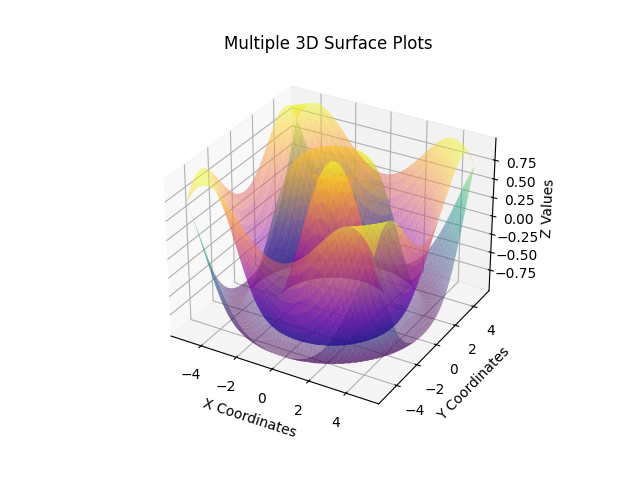
是要这个效果不:

源代码:
- import numpy as np
- import matplotlib.pyplot as plt
- from mpl_toolkits.mplot3d import Axes3D
- # 数据准备
- x = np.linspace(-5, 5, 100)
- y = np.linspace(-5, 5, 100)
- x, y = np.meshgrid(x, y)
- z1 = np.sin(np.sqrt(x**2 + y**2))
- z2 = np.cos(np.sqrt(x**2 + y**2))
- # 绘制
- fig = plt.figure()
- ax = fig.add_subplot(111, projection='3d')
- # 绘制两个曲面
- surf1 = ax.plot_surface(x, y, z1, cmap='viridis', alpha=0.5)
- surf2 = ax.plot_surface(x, y, z2, cmap='plasma', alpha=0.5)
- # 设置标签和标题
- ax.set_xlabel('X Coordinates')
- ax.set_ylabel('Y Coordinates')
- ax.set_zlabel('Z Values')
- ax.set_title('Multiple 3D Surface Plots')
- # 显示图形
- plt.show()
|
|
 ( 粤ICP备18085999号-1 | 粤公网安备 44051102000585号)