|
|
60鱼币
import time
import pandas
from random import *
from tkinter import *
from threading import *
from tkinter import PhotoImage
from tkinter.ttk import *
from tkinter.messagebox import *
from tkinter.simpledialog import *
t = 1
btnList = [] # 储存组件,方便删除
cake = [0, 0, 0, 0, 0, 1, 26, []] # 储存饼状图的颜色,和概率,和2个柱状图的概率
m = 600
n = 500
root = Tk() # 创建tkinter应用程序
root.config(bg="black") # 更改背景色
x = root.winfo_screenwidth()
y = root.winfo_screenheight()
root.geometry(str(m) + 'x' + str(n) + '+' + str((x - m) // 2) + '+' + str((y - n) // 2)) # 窗口初始大小和位置;居中
root.title('实验' + str(x) + str(y)) # 窗口标题
root.resizable(False, False) # 不允许改变窗口大小
# 清空所有组件
def Empiy():
global btnList
for List in btnList:
List.destroy()
btnList = []
# 点击左柱状图
def Press_Column1():
global cake
cake[5] = 0 # 代表按钮已经按下
cake[4] = cake[2]
cake[2] = 1
# 先删除所有组件,然后输出进度条,打印结果提示和十字
Empiy()
Progress_bar()
result()
# 点击右柱状图
def Press_Column2():
global cake
cake[5] = 0
cake[4] = cake[3]
cake[3] = 1
Empiy()
Progress_bar()
result()
# 生成随机饼状图;第一次使用时随机颜色,和得失组然后把数据存储在cake[0]里面
# cake[1]为空时随机概率,然后把数据存储在cake[1]里面
def Chart():
global btnList
global cake
if not cake[0]:
if randint(0, 1):
cake[0] = ("orange", randint(0, 1))
else:
cake[0] = ("purple", randint(0, 1))
if not cake[1]:
cake[1] = randint(1, 9) # 随机饼状图的概率
global char
char = PhotoImage(file=f"./{cake[0][0]}-{cake[1]}.gif")
label = Label(root, image=char)
label.place(x=195, y=50, width=200, height=200)
btnList.append(label) # 储存到列表里,不然不好删除
# 生成随机柱状图;cake[2]为空时随机概率,然后把数据存储在cake[2],cake[3]里面
# seat=1时左,seat=0时右;fun=1时可以点击按钮,fun=0时按钮无法按下
def Histofram(seat, fun):
global btnList
if not cake[2]:
cake[2] = randrange(11)
cake[3] = randrange(11)
while cake[3] == cake[2]:
cake[3] = randrange(11)
if seat: # 左
global column1
column1 = PhotoImage(file=f"./Histogram-{cake[2]}.gif")
if fun:
button1 = Button(root, image=column1, command=Press_Column1)
else:
button1 = Button(root, image=column1)
button1.place(x=110, y=220, width=95, height=251)
btnList.append(button1) # 储存到列表里,不然不好删除
else:
global column2
column2 = PhotoImage(file=f"./Histogram-{cake[3]}.gif")
if fun:
button2 = Button(root, image=column2, command=Press_Column2)
else:
button2 = Button(root, image=column2)
button2.place(x=400, y=220, width=95, height=251)
btnList.append(button2)
# 控制饼状图和柱状图的生成与消失
def generata_Chart():
chart = [1, 2, 3]
for i in range(3):
a = randrange(3 - i)
a = chart.pop(a)
if a == 1:
Chart()
elif a == 2:
Histofram(1, 0)
elif a == 3:
Histofram(0, 0)
root.update() # 刷新画面
time.sleep(1) # 暂停
Empiy()
Chart()
Histofram(1, 1)
Histofram(0, 1)
# 打印进度条
def Progress_bar():
global cake
f = Frame(root)
f.place(x=165, y=200, width=270, height=20)
if randrange(1, 11) <= cake[4]:
cake[4] = 1
f.config(bg="green")
else:
cake[4] = 0
f.config(bg="red")
for i in range(276):
f.place(x=165 + i, y=199.5 + randint(0, 1), width=270 - i, height=20)
root.update() # 刷新画面
time.sleep(0.01) # 暂停
f.destroy()
# 打印结果提示和十字
def result():
global cake
# 打印结果提示
l = Label(root, bg="black", fg="white", font=("宋体", 100))
l.place(relx=0.28, rely=0.35)
if cake[4]:
if randrange(1, 11) <= cake[2]:
if cake[0][1]:
l.config(text="WIN")
else:
l.config(text="LOSE")
else:
l.config(text="ZERO")
else:
l.config(text="XXXX")
root.update() # 刷新画面
time.sleep(1) # 暂停
l.destroy()
# 打印十字
l = 0.0004
k = 0.02
s1 = Frame(root, bg="white")
s1.place(relx=(1 - l) / 2, rely=(1 - k) / 2, relwidth=l, relheight=k)
s2 = Frame(root, bg="white")
s2.place(relx=(1 - k) / 2, rely=(1 - l) / 2, relwidth=k, relheight=l)
root.update() # 刷新画面
time.sleep(1) # 暂停
s1.destroy()
s2.destroy()
# 此时这一轮结束了,开始新的一轮
next()
# 计时函数;多线程使用
def count_down():
global cake
cake[5] = 1
time.sleep(3)
if cake[5]:
Empiy()
l = Label(root, bg="black", fg="white", font=("宋体", 40))
l.place(relx=0.03, rely=0.4)
l.config(text="太晚了!等待下一次试验")
root.update() # 刷新画面
time.sleep(t) # 暂停
l.destroy()
next()
# 储存数据 ;i=0时累计,i=1时储存进文件,i=2时储存进txt文件
def store_data(i):
global cake
if i == 2:
txt = ' 运行轮次 饼状图颜色 测试组别 饼状图概率 左柱状图概率 右柱状图概率 选择\n'
for info in cake[7]:
txt += ' '*4 + f"{info['运行轮次']}" + ' '*4
txt += ' '*2 + f"{info['饼状图颜色']}" + ' '*3
txt += ' ' + f"{info['测试组别']}" + ' '*2
txt += ' '*4 + f"{info['饼状图概率']}" + ' '*4
txt += ' '*5 + f"{info['左柱状图概率']}" + ' '*5
txt += ' '*5 + f"{info['右柱状图概率']}" + ' '*5
txt += ' ' + f"{info['选择']}" + ' '
txt += '\n'
f = open("信息.txt", "w")
f.write(txt)
elif i:
panda = pandas.DataFrame()
panda['运行轮次'] = [info['运行轮次'] for info in cake[7]]
panda['饼状图颜色'] = [info['饼状图颜色'] for info in cake[7]]
panda['测试组别'] = [info['测试组别'] for info in cake[7]]
panda['饼状图概率'] = [info['饼状图概率'] for info in cake[7]]
panda['左柱状图概率'] = [info['左柱状图概率'] for info in cake[7]]
panda['右柱状图概率'] = [info['右柱状图概率'] for info in cake[7]]
panda['选择'] = [info['选择'] for info in cake[7]]
print(panda)
panda.to_excel("信息.xlsx", index=False)
else:
info = {}
info['运行轮次'] = cake[6]
info['饼状图颜色'] = cake[0][0]
if cake[0][1]:
info['测试组别'] = '获得组'
else:
info['测试组别'] = '失去组'
info['饼状图概率'] = f'{cake[1]}0%'
info['左柱状图概率'] = f'{cake[2]}0%'
info['右柱状图概率'] = f'{cake[3]}0%'
if cake[5] == 1:
info['选择'] = '超时'
elif 1 == cake[2]:
info['选择'] = '左图'
elif 1 == cake[3]:
info['选择'] = '右图'
cake[7].append(info)
# 开始下一轮或退出
def next():
global cake
if cake[6] != 26:
store_data(0)
if cake[6] < 30:
cake[6] += 1 # 记录已经运行的次数
t = Thread(target=count_down)
# 重置饼状图和柱状图的概率
cake[1] = cake[2] = cake[2] = 0
generata_Chart()
# 多线程,generata_Chart执行完后开始计时
t.start()
else:
store_data(1)
store_data(2)
showinfo("结束", "退出应用")
root.destroy()
# 按下开始时执行的函数;调用所有的函数
def main():
start.destroy()
next()
# 打印开始按钮;按下时开始程序
start = Button(root, text='开始', command=main)
start.place(relx=0.4, rely=0.425, relwidth=0.2, relheight=0.15)
root.mainloop()
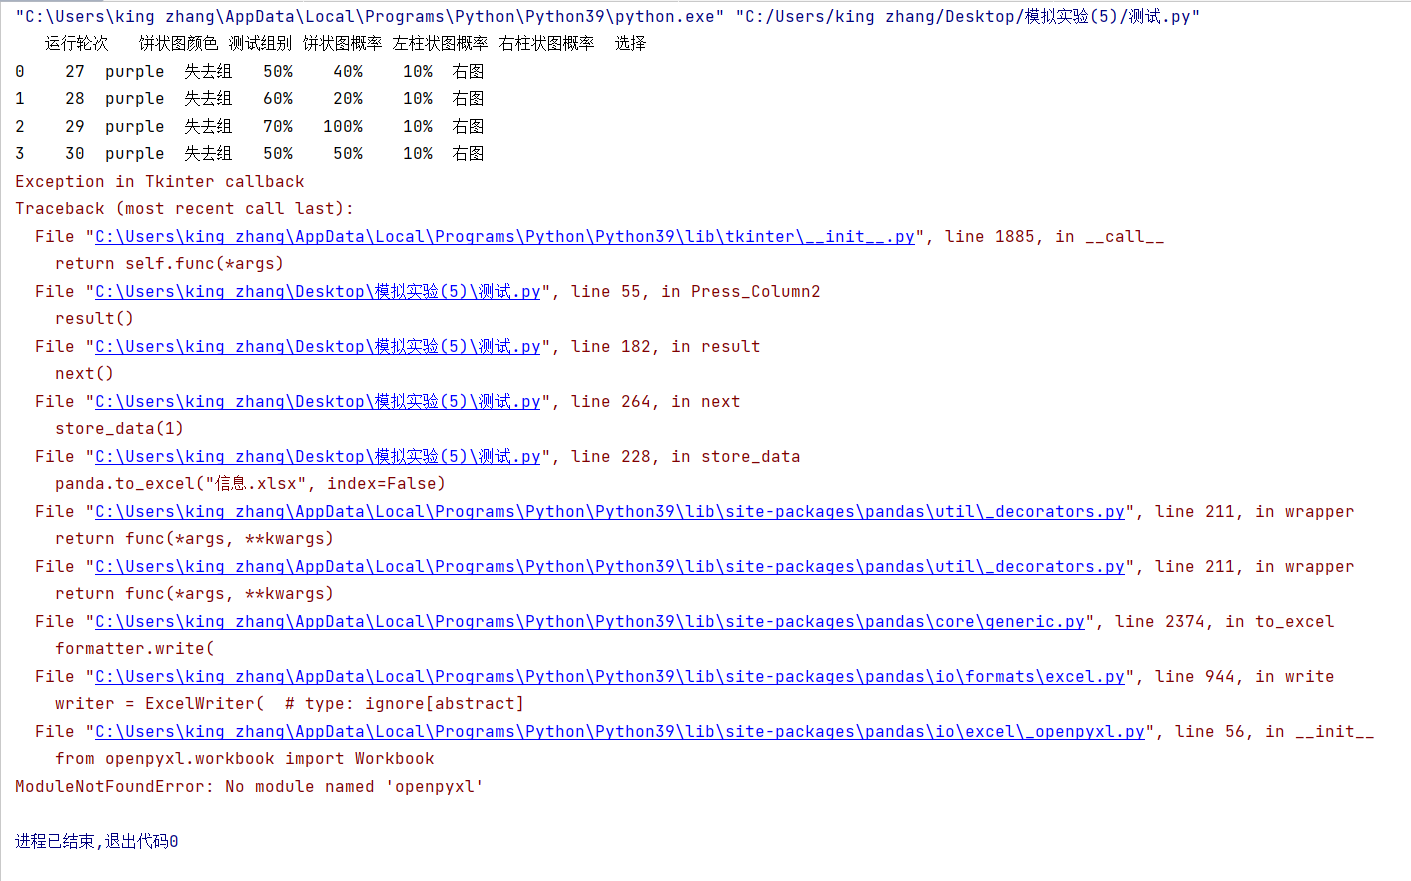
报错情况:
你没有安装 openpyxl
在 cmd 执行以下命令安装 openpyxl
- pip install openpyxl -i https://mirrors.aliyun.com/pypi/simple
|
-

最佳答案
查看完整内容
你没有安装 openpyxl
在 cmd 执行以下命令安装 openpyxl
|
 ( 粤ICP备18085999号-1 | 粤公网安备 44051102000585号)