|
|
马上注册,结交更多好友,享用更多功能^_^
您需要 登录 才可以下载或查看,没有账号?立即注册
x
本帖最后由 回忆一遥远 于 2017-8-16 07:31 编辑
安装过程
① 为了方便,直接安装了 Anaconda 2.7 版本
② 安装 stikit-learn
③ 安装 Graphviz (转化 dot 文件到 pdf 可视化决策树 )
④ 把 Graphviz 加入环境变量
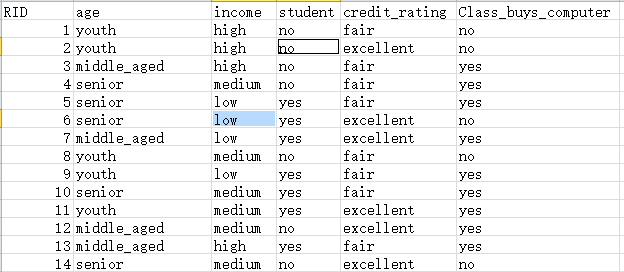
需要处理的数据如图

生成的决策树文档
digraph Tree {
node [shape=box] ;
0 [label="age=middle_aged <= 0.5\nentropy = 0.9403\nsamples = 14\nvalue = [5, 9]"] ;
1 [label="student=no <= 0.5\nentropy = 1.0\nsamples = 10\nvalue = [5, 5]"] ;
0 -> 1 [labeldistance=2.5, labelangle=45, headlabel="True"] ;
2 [label="credit_rating=excellent <= 0.5\nentropy = 0.7219\nsamples = 5\nvalue = [1, 4]"] ;
1 -> 2 ;
3 [label="entropy = 0.0\nsamples = 3\nvalue = [0, 3]"] ;
2 -> 3 ;
4 [label="age=youth <= 0.5\nentropy = 1.0\nsamples = 2\nvalue = [1, 1]"] ;
2 -> 4 ;
5 [label="entropy = 0.0\nsamples = 1\nvalue = [1, 0]"] ;
4 -> 5 ;
6 [label="entropy = 0.0\nsamples = 1\nvalue = [0, 1]"] ;
4 -> 6 ;
7 [label="age=youth <= 0.5\nentropy = 0.7219\nsamples = 5\nvalue = [4, 1]"] ;
1 -> 7 ;
8 [label="credit_rating=excellent <= 0.5\nentropy = 1.0\nsamples = 2\nvalue = [1, 1]"] ;
7 -> 8 ;
9 [label="entropy = 0.0\nsamples = 1\nvalue = [0, 1]"] ;
8 -> 9 ;
10 [label="entropy = 0.0\nsamples = 1\nvalue = [1, 0]"] ;
8 -> 10 ;
11 [label="entropy = 0.0\nsamples = 3\nvalue = [3, 0]"] ;
7 -> 11 ;
12 [label="entropy = 0.0\nsamples = 4\nvalue = [0, 4]"] ;
0 -> 12 [labeldistance=2.5, labelangle=-45, headlabel="False"] ;
}
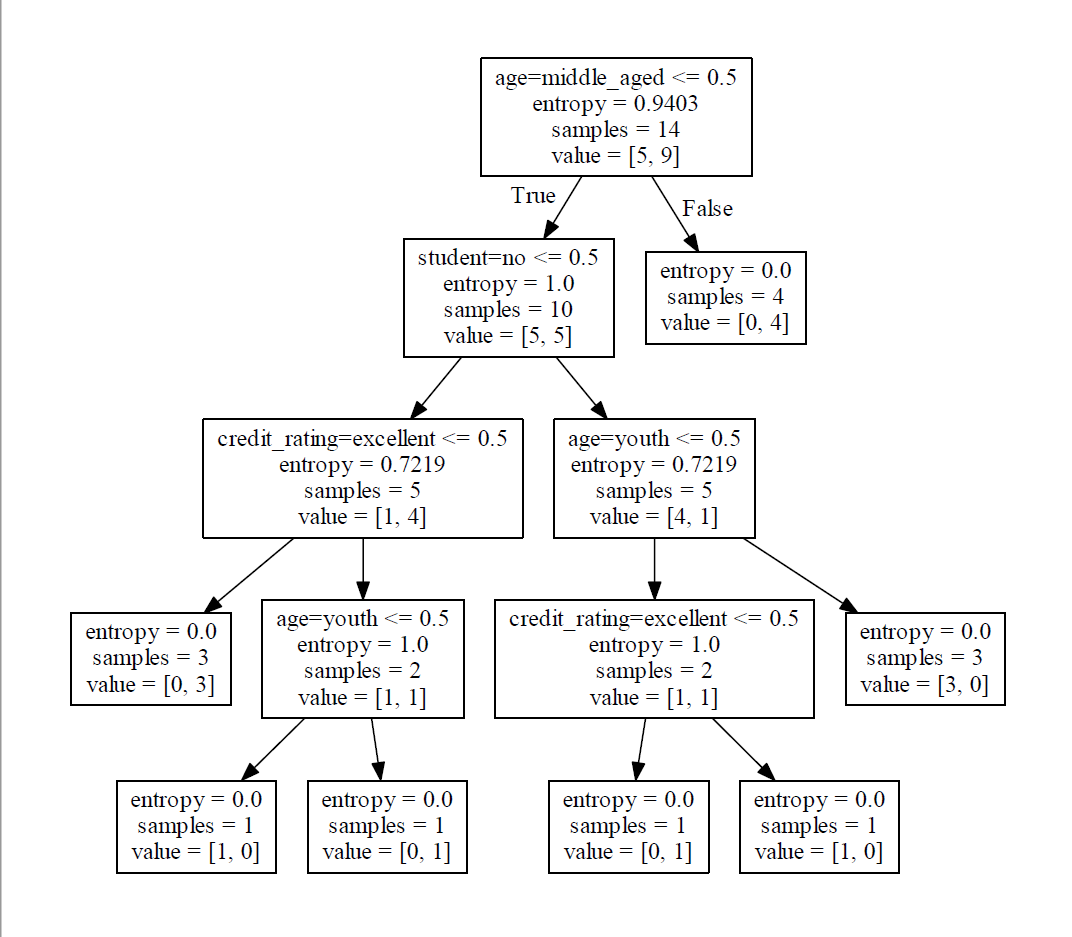
使用 Graphviz 可视化后的树:
方法: 使用 cmd ,使用命令 dot -Tpdf iris.dot -o output.pdf
# iris.dot 是 dot 的路径 ,output.pdf 是处理后的文件
巨长的转化命令:

转化后的可视化决策树:

编写的代码
- # -*- coding: utf-8 -*-
- # 不加上面这个注释,默认读取 ASCll 编码,在用 utf-8 格式的编译器里会出错
- from sklearn.feature_extraction import DictVectorizer
- import csv
- from sklearn import preprocessing
- from sklearn import tree
- from sklearn.externals.six import StringIO
- # sklearn 要求是数值型的值,需要转化
- # 预处理数据的开始
- # 读取 csv 文件数据
- allElectronicsData = open(r'D:\Temp\Test1.csv', 'rb')
- # reader 在 csv 文件中按行读取
- reader = csv.reader(allElectronicsData)
- # headers 是 csv 文件中第一行
- headers = reader.next()
- print(headers)
- # 装取特征值信息
- featureList = []
- # 装取类别的值
- labelList = []
- # reader 是数据内容 , row 是其中一行
- for row in reader:
- # 取每一行最后一个值
- labelList.append(row[len(row) - 1])
- rowDict = {}
- # 取每一行各特征值
- for i in range(1, len(row) - 1):
- rowDict[headers[i]] = row[i]
- # 特征值字典
- featureList.append(rowDict)
-
- print(featureList)
- # 矢量特征
- # 使用 DictVectorizer 把数据数值化
- vec = DictVectorizer()
- dummyX = vec.fit_transform(featureList).toarray()
- print("dummyX: " + str(dummyX))
- print(vec.get_feature_names())
- print("Labellist: " + str(labelList))
- # 矢量化类标签
- lb = preprocessing.LabelBinarizer()
- dummyY = lb.fit_transform(labelList)
- print("dummyY: " + str(dummyY))
- # 处理数据结束
- # 用决策树进行分类
- # 用 DecisionTreeClassifier 进行模型的创建
- # DecisionTreeClassifier 分类器创建决策树, entropy 信息熵的算法
- clf = tree.DecisionTreeClassifier(criterion = 'entropy')
- # 构建决策树
- clf = clf.fit(dummyX, dummyY)
- print("clf: " + str(clf))
- # 观测模型
- with open("allElectronicInformationGainOri.dot", 'w') as f:
- # 画出决策树,并且还原数值
- f = tree.export_graphviz(clf, feature_names=vec.get_feature_names(), out_file = f)
- # 决策树构建结束,并输出结果
- # 预测功能
- # 取原训练集中的数据改动后,利用机器学习判断一个人买不买电脑
- oneRowX = dummyX[0, :]
- print("oneRowX: " + str(oneRowX))
-
- newRowX = oneRowX
-
- newRowX[0] = 1
- newRowX[2] = 0
- print("newRowX: " + str(newRowX))
-
- predictedY = clf.predict(newRowX)
- print("predictedY: " + str(predictedY))
- # predicted 的结果由原来的0(不买)变成了1(买)
- # 已经可以预测一个人是否买电脑了
输出的结果:
- ['RID', 'age', 'income', 'student', 'credit_rating', 'Class_buys_computer']
- [{'credit_rating': 'fair', 'age': 'youth', 'student': 'no', 'income': 'high'}, {'credit_rating': 'excellent', 'age': 'youth', 'student': 'no', 'income': 'high'}, {'credit_rating': 'fair', 'age': 'middle_aged', 'student': 'no', 'income': 'high'}, {'credit_rating': 'fair', 'age': 'senior', 'student': 'no', 'income': 'medium'}, {'credit_rating': 'fair', 'age': 'senior', 'student': 'yes', 'income': 'low'}, {'credit_rating': 'excellent', 'age': 'senior', 'student': 'yes', 'income': 'low'}, {'credit_rating': 'excellent', 'age': 'middle_aged', 'student': 'yes', 'income': 'low'}, {'credit_rating': 'fair', 'age': 'youth', 'student': 'no', 'income': 'medium'}, {'credit_rating': 'fair', 'age': 'youth', 'student': 'yes', 'income': 'low'}, {'credit_rating': 'fair', 'age': 'senior', 'student': 'yes', 'income': 'medium'}, {'credit_rating': 'excellent', 'age': 'youth', 'student': 'yes', 'income': 'medium'}, {'credit_rating': 'excellent', 'age': 'middle_aged', 'student': 'no', 'income': 'medium'}, {'credit_rating': 'fair', 'age': 'middle_aged', 'student': 'yes', 'income': 'high'}, {'credit_rating': 'excellent', 'age': 'senior', 'student': 'no', 'income': 'medium'}]
- dummyX: [[ 0. 0. 1. 0. 1. 1. 0. 0. 1. 0.]
- [ 0. 0. 1. 1. 0. 1. 0. 0. 1. 0.]
- [ 1. 0. 0. 0. 1. 1. 0. 0. 1. 0.]
- [ 0. 1. 0. 0. 1. 0. 0. 1. 1. 0.]
- [ 0. 1. 0. 0. 1. 0. 1. 0. 0. 1.]
- [ 0. 1. 0. 1. 0. 0. 1. 0. 0. 1.]
- [ 1. 0. 0. 1. 0. 0. 1. 0. 0. 1.]
- [ 0. 0. 1. 0. 1. 0. 0. 1. 1. 0.]
- [ 0. 0. 1. 0. 1. 0. 1. 0. 0. 1.]
- [ 0. 1. 0. 0. 1. 0. 0. 1. 0. 1.]
- [ 0. 0. 1. 1. 0. 0. 0. 1. 0. 1.]
- [ 1. 0. 0. 1. 0. 0. 0. 1. 1. 0.]
- [ 1. 0. 0. 0. 1. 1. 0. 0. 0. 1.]
- [ 0. 1. 0. 1. 0. 0. 0. 1. 1. 0.]]
- ['age=middle_aged', 'age=senior', 'age=youth', 'credit_rating=excellent', 'credit_rating=fair', 'income=high', 'income=low', 'income=medium', 'student=no', 'student=yes']
- Labellist: ['no', 'no', 'yes', 'yes', 'yes', 'no', 'yes', 'no', 'yes', 'yes', 'yes', 'yes', 'yes', 'no']
- dummyY: [[0]
- [0]
- [1]
- [1]
- [1]
- [0]
- [1]
- [0]
- [1]
- [1]
- [1]
- [1]
- [1]
- [0]]
- clf: DecisionTreeClassifier(class_weight=None, criterion='entropy', max_depth=None,
- max_features=None, max_leaf_nodes=None,
- min_impurity_split=1e-07, min_samples_leaf=1,
- min_samples_split=2, min_weight_fraction_leaf=0.0,
- presort=False, random_state=None, splitter='best')
- oneRowX: [ 0. 0. 1. 0. 1. 1. 0. 0. 1. 0.]
- newRowX: [ 1. 0. 0. 0. 1. 1. 0. 0. 1. 0.]
- predictedY: [1]
小结
这个决策树使用的是 ID3 算法 (一种贪心算法)
它是通过信息熵的大小来进行分类处理的
另外,有鱼油知道 C++ 的深度学习的资料或视频吗? 我不想学 Python 的啊~~~~~~ 
|
评分
-
查看全部评分
|
 ( 粤ICP备18085999号-1 | 粤公网安备 44051102000585号)