|
|
马上注册,结交更多好友,享用更多功能^_^
您需要 登录 才可以下载或查看,没有账号?立即注册
x
先说情况:
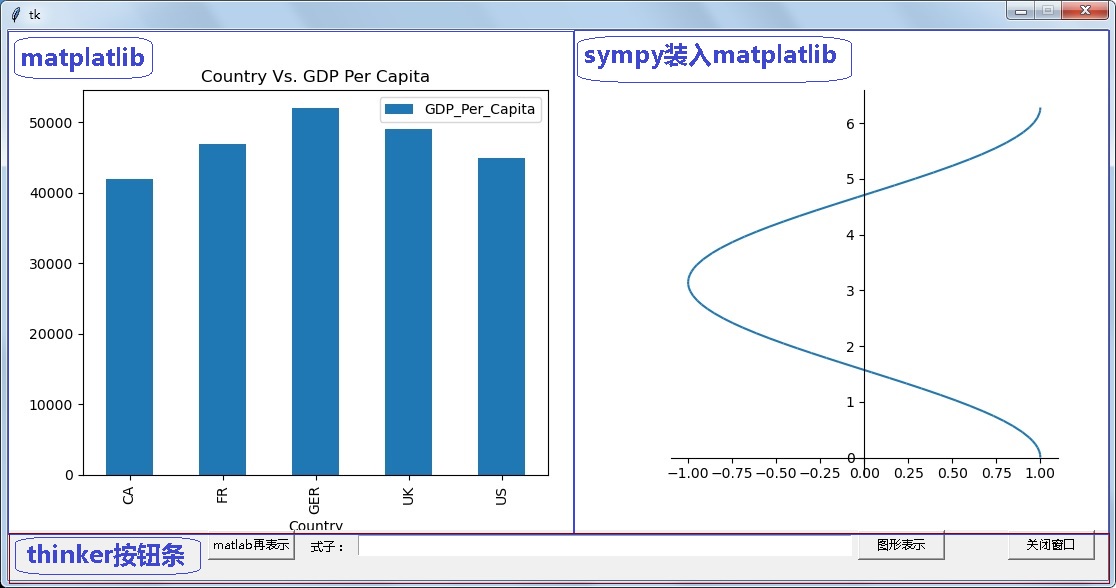
再把sympy装进matplatlib,再开一个条形窗口放按钮(至于这么干有啥意义,不是讨论的内容)

就是这样的效果,参考的东西太多了,七拼八凑搞起来的(问题求助就贴就不列举感谢网址了)
点击matplotlib下的按钮可以变化左边条形图的表示内容,准备了4个样本
右边点击图形表示,可以变变化右上窗口的表示内容(实际有问题,因为调用走一个调用matplotlib,再调用sympy的过程,途中有隐含窗体被创建,代码中努力消去这个窗口,执行20多次,还是会出窗体数量超标的警告),这个数据也准备了4个图形函数样本。左边matplotlib的话,只是单纯,数据清空,再填入,再表示,按多少次都没有问题。希望的是,右边按钮和左边同样,无论按多少次都不会处警告
为啥要加sympy呢,主要是他有隐函数模拟比如:x**2+y**2-5=0,这是一个圆方程,但是如果复杂的话,很难转成y=f(x)这样的形式,这个比较牛,所以想把他装进来。另外刷新,是因为想可以手动输入方程,然后点图形显示(实际它有许多方程的表示法,这个隐方程的网上例子太少了,连他官网也没啥例子,更不用说怎么装到matplotlib,还要提供按键接受输入框输入的方程,所以这个没有实现,只是用了plot_parametric(cos(x), sin(x), (x, 0, 2*pi), show=False)这样的方程形式)。关闭窗口还是要按“关闭”按钮,因为里面执行了代码“plt.close('all')”,会关闭所有窗体(包括隐含的),直接按windows的“×”可能会内存泄漏。。。
想法源于:数学之美——你见过哪些优美的数学方程曲线?
这里面:极坐标r=f(θ)可能没问题,有些类似:(x^2+y^2-1)^2=x^3,好像没法解,当然可以区域模拟:给范围,用足够小的分辨率,一个坐标一个坐标模拟,然后结果是等式两边相减接近0。不过想到python有许多库,不用自己做,果然找到了sympy,然后想把sympy装到thinker,没有直接装的例子,无从下手,找到sympy装到matplatlib例子,然后matplatlib装入thinker官网就有例子的,再就是既然装了两个,再加一个按钮条,加了按钮条总不能什么都不做,就想要上边两个窗体的刷新(数据都列举在代码中了,可以直接运行的,右边按钮点30次一定会出窗体数超标吧。。。):
- import tkinter as tk
- from tkinter import *
- from pandas import DataFrame
- import matplotlib.pyplot as plt
- from matplotlib.backends.backend_tkagg import FigureCanvasTkAgg
- from sympy.plotting.plot import plot_parametric
- import sympy.geometry.util
- from sympy import *
- from sympy.abc import x,y,z
- from sympy import plot_implicit
- #ezplot = lambda exper: plot_implicit(parse_expr(exper))#用了匿名函数
- class App:
- data1 = [{'Country': ['US','CA','GER','UK','FR'],
- 'GDP_Per_Capita': [45000,42000,52000,49000,47000]
- },
- {'Country': ['US','CA','GER','UK','FR'],
- 'GDP_Per_Capita': [35000,42000,50000,43000,52000]
- },
- {'Country': ['US','CA','GER','UK','FR'],
- 'GDP_Per_Capita': [42000,52000,49000,47000,45000]
- },
- {'Country': ['US','CA','GER','UK','FR'],
- 'GDP_Per_Capita': [52000,49000,47000,45000,42000]
- }]
- data1_ptr = 0
- line2_ptr = 0
-
- def __init__(self):
- #------------------------------------------------
- #tkinter 画面划分
- #------------------------------------------------
- root= tk.Tk()
- root.resizable(0,0)
- embed = tk.Frame(root, width = 1100, height = 550) #creates embed frame for pygame window
- embed.grid(columnspan = (1100), rowspan = 500) # Adds grid
- embed.pack(side = TOP) #packs window to the left
- buttonwin = tk.Frame(root, width = 1100, height = 50)
- buttonwin.pack(side = BOTTOM)
- #------------------------------------------------
- #
- #------------------------------------------------
-
- #控件定义区 =====================================
- button_mat_b = Button(buttonwin,text = 'matlab再表示', width=11, command=self.show_mat)
- button_mat_b.place(x=200,y=0)
- btnwin_fl_l = tk.Label(buttonwin, text='式子:')
- btnwin_fl_l.place(x=300,y=5)
- inputfl = StringVar()
- btnwin_fl_e = tk.Entry(buttonwin, width=70,textvariable = inputfl)
- btnwin_fl_e.place(x=350,y=5)
- button_show_b = Button(buttonwin,text = '图形表示', width=11, command=self.show_fl)
- button_show_b.place(x=850,y=0)
- button_show_b = Button(buttonwin,text = '关闭窗口', width=11, command=self.exit)
- button_show_b.place(x=1000,y=0)
-
- #matplotlib,matplotlib内嵌sympy子窗体
- figure1 = plt.Figure(figsize=(6,5), dpi=100)
- ax1 = figure1.add_subplot(111)
- bar1 = FigureCanvasTkAgg(figure1, embed)
- bar1.get_tk_widget().pack(side=tk.LEFT, fill=tk.BOTH)
- df1 = DataFrame(App.data1[0],columns=['Country','GDP_Per_Capita'])
- df1 = df1[['Country','GDP_Per_Capita']].groupby('Country').sum()
- df1.plot(kind='bar', legend=True, ax=ax1)
- ax1.set_title('Country Vs. GDP Per Capita')
- figure2 = plt.Figure(figsize=(5,4), dpi=100)
- p2 = self.get_plot_parametric()
- ax2 = figure2.add_subplot(111)
- self.move_sympyplot_to_axes(p2, ax2)
- line2 = FigureCanvasTkAgg(figure2, embed)
- line2.get_tk_widget().pack(side=tk.RIGHT, fill=tk.BOTH)
-
- #---------------------------- 对外接口
- App.root = root
- App.bar1 = bar1
- App.figure1 = figure1
- App.ax1 = ax1
- App.figure2 = figure2
- App.line2 = line2
- App.ax2 = ax2
-
- #按钮动作区 =====================================
- def exit(self):
- plt.close('all')
- App.root.quit() # stops mainloop
- App.root.destroy() # this is necessary on Windows to prevent
-
- def show_mat(self):
- App.data1_ptr = (App.data1_ptr+1)%4
- App.figure1.clear()
- App.ax1.clear()
- App.ax1 = App.figure1.add_subplot(111)
- App.df1 = DataFrame(App.data1[App.data1_ptr],columns=['Country','GDP_Per_Capita'])
- App.df1 = App.df1[['Country','GDP_Per_Capita']].groupby('Country').sum()
- App.df1.plot(kind='bar', legend=True, ax=App.ax1)
- App.ax1.set_title('Country Vs. GDP Per Capita')
- App.bar1.draw()
-
- def get_plot_parametric(self):
- App.line2_ptr = (App.line2_ptr+1) % 4
- if App.line2_ptr == 0:
- return plot_parametric(cos(x), sin(x), (x, 0, 2*pi), show=False)
- elif App.line2_ptr == 1:
- return plot_parametric(cos(x), x, (x, 0, 2*pi), show=False)
- elif App.line2_ptr == 2:
- return plot_parametric(cos(x), cos(x), (x, -5, 5), show=False)
- else:
- return plot_parametric(2*x, sin(x), (x, 0, 2*pi), show=False)
- def show_fl(self):
- App.figure2.clear()
- App.p2 = self.get_plot_parametric()
- App.ax2 = App.figure2.add_subplot(111)
- self.move_sympyplot_to_axes(App.p2, App.ax2)
- App.line2.draw()
- def move_sympyplot_to_axes(self,p, ax):
- backend = p.backend(p)
- backend.ax = ax
- # Fix for > sympy v1.5
- backend._process_series(backend.parent._series, ax, backend.parent)
- backend.ax.spines['right'].set_color('none')
- backend.ax.spines['bottom'].set_position('zero')
- backend.ax.spines['top'].set_color('none')
- #plt.close(backend.fig)
- plt.close(plt.figure())
-
- App().root.mainloop()
|
|
 ( 粤ICP备18085999号-1 | 粤公网安备 44051102000585号)