|
|
马上注册,结交更多好友,享用更多功能^_^
您需要 登录 才可以下载或查看,没有账号?立即注册
x
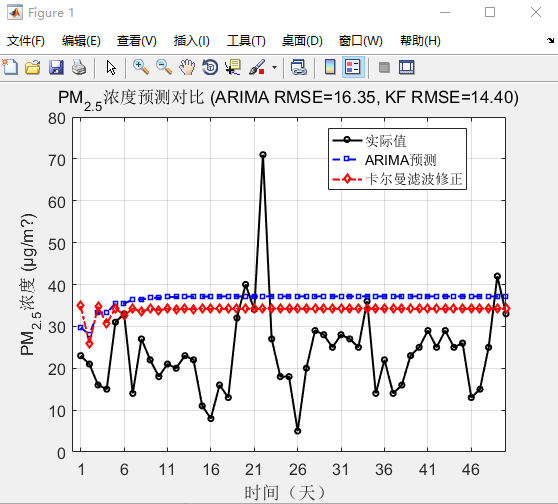
这是我用卡尔曼滤波器去预测PM2.5浓度的一段代码,但是我的结果出现了如图片中预测值后面变成一条平直线的问题,请问我的代码哪里出现了问题,应该怎么改正
% 清空环境
clc;
clear;
close all;
%% 1. 数据预处理
% 读取数据
[data, ~, ~] = xlsread('dalian_pm2.5.xlsx', 'Sheet1', 'B2:B201');
observed_pm25 = data';
% 数据标准化(提升模型稳定性)
mu = mean(observed_pm25);
sigma = std(observed_pm25);
normalized_data = (observed_pm25 - mu) / sigma;
% 分割数据集
train_data = normalized_data(1:150);
test_data = normalized_data(151:end);
num_predictions = length(test_data);
%% 2. ARIMA模型优化
% --- 平稳性检验与自动定阶 ---
% ADF检验
[h, ~] = adftest(train_data);
if h == 0
fprintf('数据非平稳,自动差分...\n');
d = ndiffs(train_data); % 自动选择差分阶数
train_data_diff = diff(train_data, d);
else
d = 0;
train_data_diff = train_data;
end
% 通过AIC准则自动选择(p,q)
max_order = 3; % 最大尝试阶数
best_aic = Inf;
for p = 0:max_order
for q = 0:max_order
model = arima(p, d, q);
try
[~, ~, logL] = estimate(model, train_data_diff', 'Display', 'off');
current_aic = aicbic(logL, p + q);
if current_aic < best_aic
best_aic = current_aic;
best_p = p;
best_q = q;
end
catch
continue
end
end
end
fprintf('最优模型: ARIMA(%d,%d,%d)\n', best_p, d, best_q);
% 拟合最终模型
model = arima(best_p, d, best_q);
fit = estimate(model, train_data_diff');
%% 3. 改进的卡尔曼滤波实现
% --- 基于AR模型的扩展状态空间 ---
% 从ARIMA模型中提取AR系数
ar_coeff = cell2mat(fit.AR); % 获取AR项系数
% 构建状态空间
p = length(ar_coeff); % 状态维度=AR阶数
A = [ar_coeff;
eye(p-1), zeros(p-1, 1)]; % 状态转移矩阵
H = [1, zeros(1, p-1)]; % 观测矩阵
% 初始化参数
Q = 0.001 * eye(p); % 过程噪声(需调优)
R = 0.5; % 观测噪声(需调优)
x_hat = [train_data_diff(end:-1:end-p+1)]'; % 初始状态
P = eye(p);
% --- 预测与滤波联合过程 ---
[forecast_diff, ~, ~] = forecast(fit, num_predictions, 'Y0', train_data_diff');
% 卡尔曼滤波递归修正
filtered_diff = zeros(1, num_predictions);
for k = 1:num_predictions
% 预测步骤
x_hat_minus = A * x_hat;
P_minus = A * P * A' + Q;
% 更新步骤(使用ARIMA预测作为观测输入)
K = P_minus * H' / (H * P_minus * H' + R);
z = forecast_diff(k); % ARIMA预测值
x_hat = x_hat_minus + K * (z - H * x_hat_minus);
P = (eye(p) - K * H) * P_minus;
filtered_diff(k) = H * x_hat;
end
% --- 逆标准化与差分还原 ---
% 还原差分
if d > 0
last_obs = train_data(end-d+1:end);
forecast_values = cumsum([last_obs, forecast_diff]);
filtered_values = cumsum([last_obs, filtered_diff]);
else
forecast_values = forecast_diff;
filtered_values = filtered_diff;
end
% 截取有效部分
forecast_values = forecast_values(end-num_predictions+1:end);
filtered_values = filtered_values(end-num_predictions+1:end);
% 逆标准化
forecast_values = forecast_values * sigma + mu;
filtered_values = filtered_values * sigma + mu;
test_data_orig = test_data * sigma + mu; % 原始尺度的测试数据
%% 4. 结果分析与可视化
% 检查维度
forecast_values_size = size(forecast_values);
test_data_orig_size = size(test_data_orig);
% 确保维度一致
if forecast_values_size ~= test_data_orig_size
% 根据需要调整维度
if forecast_values_size(2) == 1
forecast_values = forecast_values';
end
if test_data_orig_size(2) == 1
test_data_orig = test_data_orig';
end
end
% 计算RMSE
rmse_arima = sqrt(mean((forecast_values - test_data_orig).^2));
% 计算误差指标
rmse_arima = sqrt(mean((forecast_values - test_data_orig).^2));
rmse_kf = sqrt(mean((filtered_values - test_data_orig).^2));
fprintf('ARIMA RMSE: %.2f\n卡尔曼滤波RMSE: %.2f\n', rmse_arima, rmse_kf);
% 动态预测效果可视化
figure;
t = 1:num_predictions;
plot(t, test_data_orig, 'k-o', 'LineWidth', 1.5, 'MarkerSize', 4);
hold on;
plot(t, forecast_values, 'b--s', 'LineWidth', 1.5, 'MarkerSize', 4);
plot(t, filtered_values, 'r-.d', 'LineWidth', 1.5, 'MarkerSize', 4);
% 图形美化
title(sprintf('PM_{2.5}浓度预测对比 (ARIMA RMSE=%.2f, KF RMSE=%.2f)', rmse_arima, rmse_kf));
xlabel('时间(天)');
ylabel('PM_{2.5}浓度 (μg/m?)');
legend('实际值', 'ARIMA预测', '卡尔曼滤波修正', 'Location', 'best');
grid on;
set(gca, 'FontSize', 12, 'XTick', 1:5:num_predictions);
% 残差分析
figure;
subplot(2,1,1);
plot(t, test_data_orig - forecast_values, 'b', 'LineWidth', 1.5);
hold on;
plot(t, test_data_orig - filtered_values, 'r', 'LineWidth', 1.5);
title('预测残差序列');
legend('ARIMA残差', 'KF残差', 'Location', 'best');
grid on;
subplot(2,1,2);
histogram(test_data_orig - forecast_values, 'BinWidth', 5, 'FaceColor', 'b');
hold on;
histogram(test_data_orig - filtered_values, 'BinWidth', 5, 'FaceColor', 'r');
title('残差分布直方图');
legend('ARIMA', 'KF');

|
|
 ( 粤ICP备18085999号-1 | 粤公网安备 44051102000585号)