鱼C论坛

 找回密码
 立即注册
查看: 1414|回复: 2

[已解决]pygal数据可视化求助!

[复制链接]
发表于 2018-1-29 11:49:16 | 显示全部楼层 |阅读模式

马上注册,结交更多好友,享用更多功能^_^

您需要 登录 才可以下载或查看,没有账号?立即注册

x
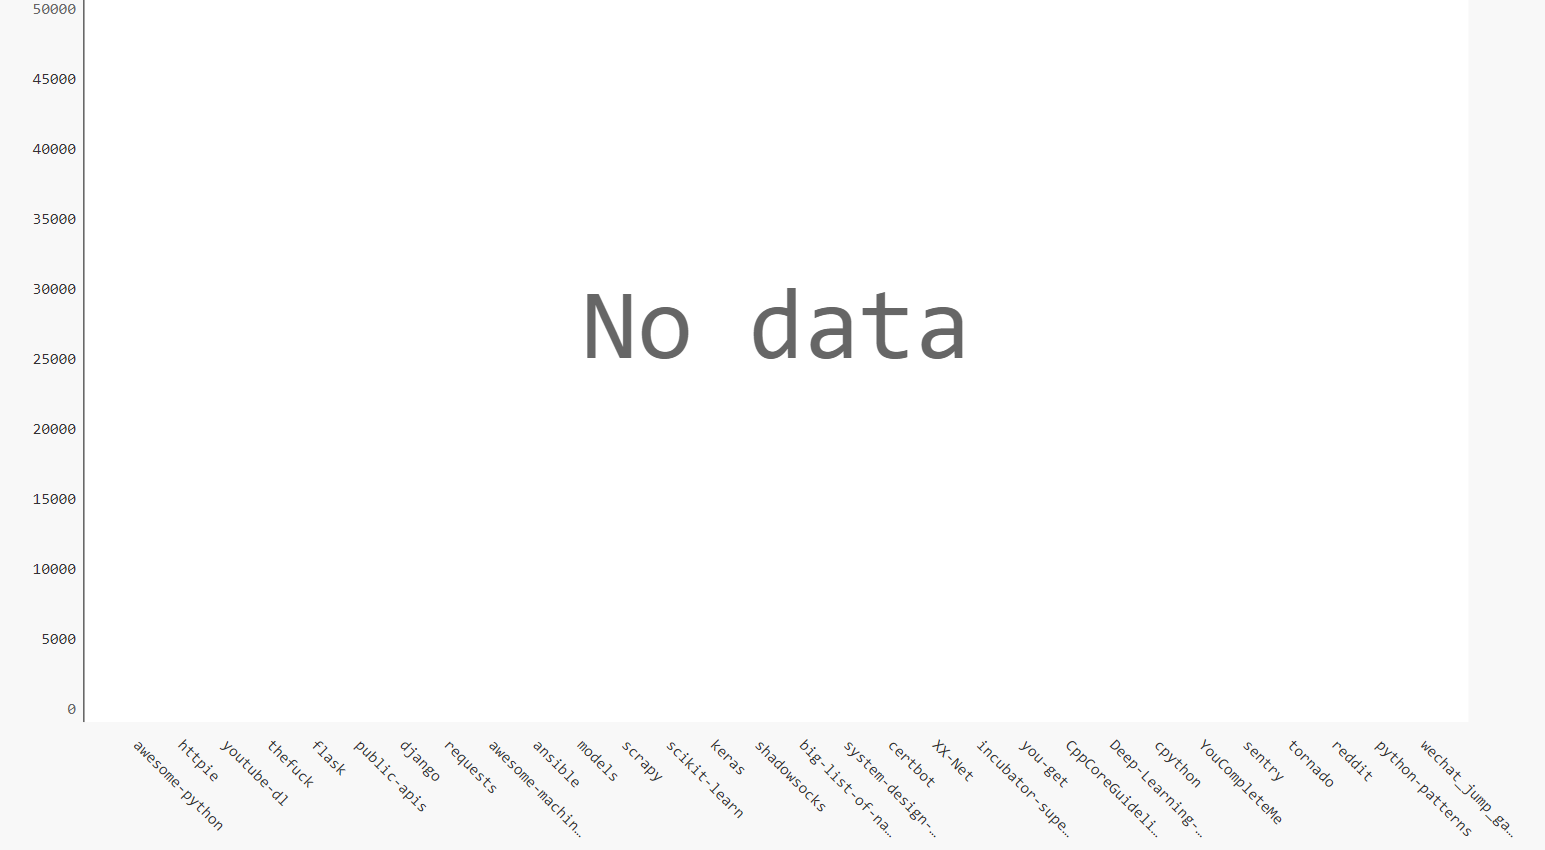
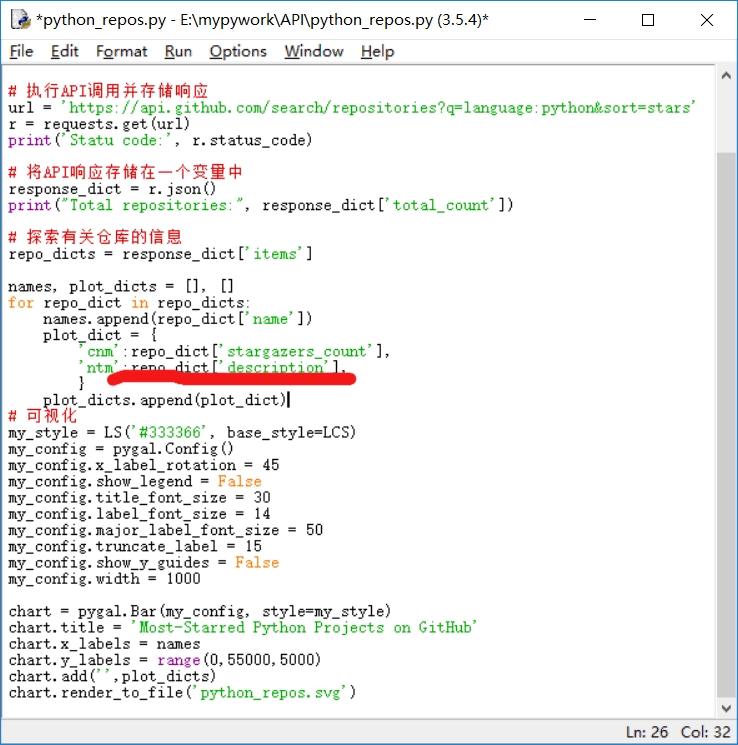
请问 可视化的数据中有表情符号导致NO data怎么办?按网上的方法还是不行。。。
import sys
non_bmp_map = dict.fromkeys(range(0x10000, sys.maxunicode + 1), 0xfffd)
这个方法试过了 也是NO data
最佳答案
2018-1-29 14:14:03
你的字典数据错误 跟图表的数据项匹配不上 应该是不满足style的条件 再加一项就可以了
  1. import requests
  2. import pygal
  3. from pygal.style import LightColorizedStyle as LCS, LightenStyle as LS
  4. url = "https://api.github.com/search/repositories?q=language:python&sort=stars"
  5. r = requests.get(url)
  6. print("Status code", r.status_code)
  7. res_dict = r.json()
  8. print("Total repos", res_dict["total_count"])

  9. items = res_dict["items"]

  10. names, plot_dicts = [], []

  11. for item in items:
  12.     names.append(item["name"])
  13.     plot_dict = {
  14.         "value": item["stargazers_count"],
  15.         "lavel": item["description"],
  16.         "xlink": item["html_url"],
  17.         #"ntm": str(item["description"]) if item["description"] else "Nothing",
  18.         }
  19.     # if "Requests" in plot_dict["ntm"]:
  20.     #     plot_dict["ntm"] = "fuck"
  21.     plot_dicts.append(plot_dict)
  22. my_style = LS('#333366', base_style=LCS)
  23. my_config = pygal.Config()
  24. my_config.x_label_rotation = 45
  25. my_config.show_legend = False
  26. my_config.title_font_size = 24
  27. my_config.label_font_size = 14
  28. my_config.major_label_font_size = 14
  29. my_config.truncate_label = 15
  30. my_config.show_y_guides = False
  31. my_config.width = 1000

  32. chart = pygal.Bar(my_config, style=my_style)
  33. chart.title = "Most-Starred Python Projects on GitHub"
  34. chart.x_labels = names
  35. chart.y_label = range(0, 55000, 5000)
  36. chart.add("", plot_dicts)
  37. chart.render_to_file("python_repos.svg")
  38. print(plot_dicts)
复制代码

可视化之后

可视化之后

就是划线的那个字典里有表情符号

就是划线的那个字典里有表情符号
想知道小甲鱼最近在做啥?请访问 -> ilovefishc.com
回复

使用道具 举报

 楼主| 发表于 2018-1-29 11:55:31 | 显示全部楼层
也有可能不是那个的原因,我把'ntm':repo_dict['description']删了还是NO data
想知道小甲鱼最近在做啥?请访问 -> ilovefishc.com
回复 支持 反对

使用道具 举报

发表于 2018-1-29 14:14:03 | 显示全部楼层    本楼为最佳答案   
你的字典数据错误 跟图表的数据项匹配不上 应该是不满足style的条件 再加一项就可以了
  1. import requests
  2. import pygal
  3. from pygal.style import LightColorizedStyle as LCS, LightenStyle as LS
  4. url = "https://api.github.com/search/repositories?q=language:python&sort=stars"
  5. r = requests.get(url)
  6. print("Status code", r.status_code)
  7. res_dict = r.json()
  8. print("Total repos", res_dict["total_count"])

  9. items = res_dict["items"]

  10. names, plot_dicts = [], []

  11. for item in items:
  12.     names.append(item["name"])
  13.     plot_dict = {
  14.         "value": item["stargazers_count"],
  15.         "lavel": item["description"],
  16.         "xlink": item["html_url"],
  17.         #"ntm": str(item["description"]) if item["description"] else "Nothing",
  18.         }
  19.     # if "Requests" in plot_dict["ntm"]:
  20.     #     plot_dict["ntm"] = "fuck"
  21.     plot_dicts.append(plot_dict)
  22. my_style = LS('#333366', base_style=LCS)
  23. my_config = pygal.Config()
  24. my_config.x_label_rotation = 45
  25. my_config.show_legend = False
  26. my_config.title_font_size = 24
  27. my_config.label_font_size = 14
  28. my_config.major_label_font_size = 14
  29. my_config.truncate_label = 15
  30. my_config.show_y_guides = False
  31. my_config.width = 1000

  32. chart = pygal.Bar(my_config, style=my_style)
  33. chart.title = "Most-Starred Python Projects on GitHub"
  34. chart.x_labels = names
  35. chart.y_label = range(0, 55000, 5000)
  36. chart.add("", plot_dicts)
  37. chart.render_to_file("python_repos.svg")
  38. print(plot_dicts)
复制代码

想知道小甲鱼最近在做啥?请访问 -> ilovefishc.com
回复 支持 反对

使用道具 举报

您需要登录后才可以回帖 登录 | 立即注册

本版积分规则

小黑屋|手机版|Archiver|鱼C工作室 ( 粤ICP备18085999号-1 | 粤公网安备 44051102000585号)

GMT+8, 2024-4-28 09:29

Powered by Discuz! X3.4

© 2001-2023 Discuz! Team.

快速回复 返回顶部 返回列表