|
|
马上注册,结交更多好友,享用更多功能^_^
您需要 登录 才可以下载或查看,没有账号?立即注册
x
昨天学习了准确和召回预测,今天学习另外一种精度更高的ROC曲线,另起一个文件把昨天有用的代码复制过来:
- from sklearn.datasets import fetch_mldata
- mnist=fetch_mldata('MNIST original',data_home='.\datasets')
- X,y=mnist["data"],mnist["target"]
- %matplotlib inline
- import matplotlib
- import matplotlib.pyplot as plt
- X_train,X_test,y_train,y_test=X[:60000],X[60000:],y[:60000],y[60000:]
- import numpy as np
- shuffle_index=np.random.permutation(60000)
- X_train,y_train=X_train[shuffle_index],y_train[shuffle_index]
- some_digit=X[36000]
- y_train_5=(y_train==5)
- y_test_5=(y_test==5)
- from sklearn.linear_model import SGDClassifier
- sgd_clf=SGDClassifier(random_state=42)
- sgd_clf.fit(X_train,y_train_5)
- from sklearn.model_selection import cross_val_predict
- y_scores=cross_val_predict(sgd_clf,X_train,y_train_5,cv=3,method="decision_function")
然后写下ROC预测的代码:
- from sklearn.metrics import roc_curve
- fpr,tpr,thresholds=roc_curve(y_train_5,y_scores[:,1])
ROC曲线主要是通过true positive rate和false positive rate,就是预测对了是5的几率,预测是5但是错了的几率,这两个值来判断准确率(具体可以参考我前天发的帖子迷糊矩阵里底下小琨的回帖,他解释的很清楚,这里非常感谢!)。以上代码里fpr和tpr变量就是这两个值。然后画出来这条曲线:
- def plot_roc_curve(fpr,tpr,label=None):
- plt.plot(fpr,tpr,linewidth=2,label=label)
- plt.plot([0,1],[0,1],'k--')
- plt.axis([0,1,0,1])
- plt.xlabel('False Positive Rate')
- plt.ylabel('True Positive Rate')
先写个函数方便以后使用,然后再调用一下:
- plot_roc_curve(fpr,tpr)
- plt.show()
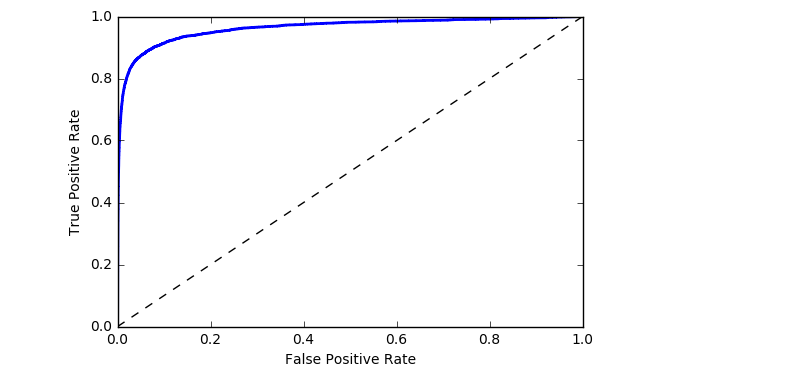
下图就是这条曲线:

可以看出来正确预测率越大,错误也就越多。这曲线底下的面积叫做AUC,面积越大越好,如果等于1就是完美,我们来计算一下AUC的值是多少:
- from sklearn.metrics import roc_auc_score
- roc_auc_score(y_train_5,y_scores[:,1])
输出为:0.96310466689500129。这是我们用随机梯度下降模型的准确率,下面再做一个随机森林分类器做个比较:
- from sklearn.ensemble import RandomForestClassifier
- forest_clf=RandomForestClassifier(random_state=42)
- y_probas_forest=cross_val_predict(forest_clf,X_train,y_train_5,cv=3,method="predict_proba")
然后做ROC曲线:
- y_scores_forest=y_probas_forest[:,1]
- fpr_forest,tpr_forest,thresholds_forest=roc_curve(y_train_5,y_scores_forest)
画图:
- plt.plot(fpr,tpr,"b",label="SGD")
- plot_roc_curve(fpr_forest,tpr_forest,"Random Forest")
- plt.legend(loc="lower right")
- plt.show()
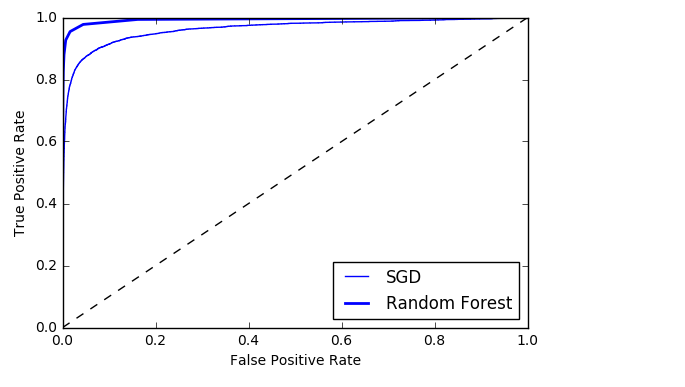
输出的图像为:

2条曲线分别为2个模型,明显随机森林曲线底下比梯度下降的大,说明随机森林这个模型精确度比较高,我们再计算下精确度是多少:
- roc_auc_score(y_train_5,y_scores_forest)
输出为:0.99319099701233393 |
|
 ( 粤ICP备18085999号-1 | 粤公网安备 44051102000585号)