|
|
马上注册,结交更多好友,享用更多功能^_^
您需要 登录 才可以下载或查看,没有账号?立即注册
x
还是把昨天代码复制过来:
- from sklearn.datasets import fetch_mldata
- mnist=fetch_mldata('MNIST original',data_home='.\datasets')
- X,y=mnist["data"],mnist["target"]
- %matplotlib inline
- import matplotlib
- import matplotlib.pyplot as plt
- X_train,X_test,y_train,y_test=X[:60000],X[60000:],y[:60000],y[60000:]
- import numpy as np
- shuffle_index=np.random.permutation(60000)
- X_train,y_train=X_train[shuffle_index],y_train[shuffle_index]
- some_digit=X[36000]
- from sklearn.linear_model import SGDClassifier
- sgd_clf=SGDClassifier(random_state=42)
然后我们分别把输出项里大于等于7的数和奇数取2组布尔值:
- from sklearn.neighbors import KNeighborsClassifier
- y_train_large=(y_train>=7)
- y_train_odd=(y_train%2==1)
- y_multilabel=np.c_[y_train_large,y_train_odd]
- y_multilabel
输出为:
array([[False, False],
[False, False],
[False, False],
...,
[False, False],
[False, False],
[False, False]], dtype=bool)
以下这种分类方法就可以一起预测2个条件:
- knn_clf=KNeighborsClassifier()
- knn_clf.fit(X_train,y_multilabel)
- knn_clf.predict([some_digit])
输出为:array([[False, True]], dtype=bool)。果然5是小于7而且是奇数。然后我们人为在图片里制造一些噪声:
- from numpy import random as rnd
- noise1=rnd.randint(0,100,(len(X_train),784))
- noise2=rnd.randint(0,100,(len(X_test),784))
- X_train_mod=X_train+noise1
- X_test_mod=X_test+noise2
- y_train_mod=X_train
- y_test_mod=X_test
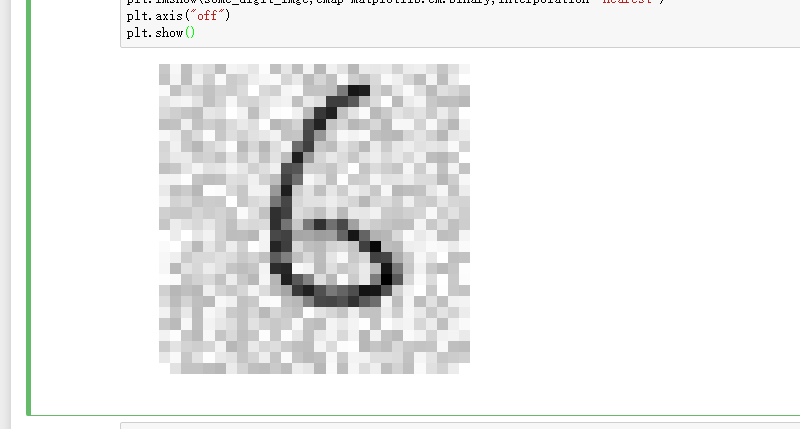
随便找个数画出图来:
- %matplotlib inline
- import matplotlib
- import matplotlib.pyplot as plt
- some_digit=X_train_mod[36000]
- some_digit_imge=some_digit.reshape(28,28)
- plt.imshow(some_digit_imge,cmap=matplotlib.cm.binary,interpolation="nearest")
- plt.axis("off")
- plt.show()
输出图像:

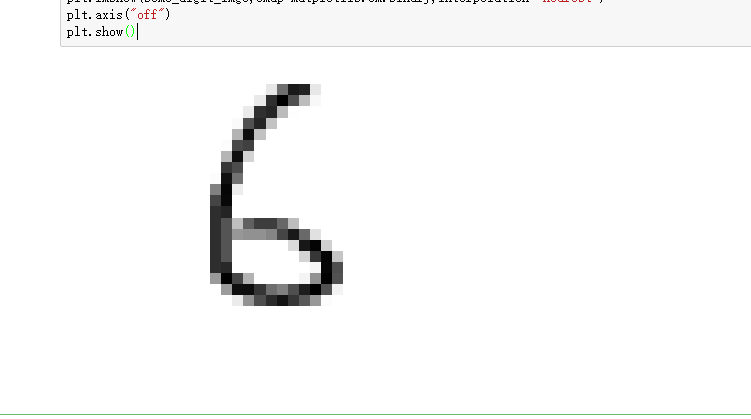
再看看原始的图片:
- %matplotlib inline
- import matplotlib
- import matplotlib.pyplot as plt
- some_digit=y_train_mod[36000]
- some_digit_imge=some_digit.reshape(28,28)
- plt.imshow(some_digit_imge,cmap=matplotlib.cm.binary,interpolation="nearest")
- plt.axis("off")
- plt.show()
输出为:

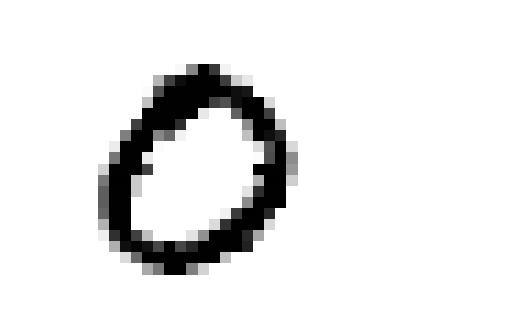
以下代码是通过上面这种分类器除去随便一张图的噪音:
- knn_clf.fit(X_train_mod,y_train_mod)
- clean_digit=knn_clf.predict([X_test_mod[100]])
然后画图:
- %matplotlib inline
- import matplotlib
- import matplotlib.pyplot as plt
- some_digit=clean_digit
- some_digit_imge=some_digit.reshape(28,28)
- plt.imshow(some_digit_imge,cmap=matplotlib.cm.binary,interpolation="nearest")
- plt.axis("off")
- plt.show()
输出图片为:

|
|
 ( 粤ICP备18085999号-1 | 粤公网安备 44051102000585号)