|
|
马上注册,结交更多好友,享用更多功能^_^
您需要 登录 才可以下载或查看,没有账号?立即注册
x
本帖最后由 脑子 于 2020-3-20 23:55 编辑
- import matplotlib.pyplot as plt
- import numpy as np
- x = np.linspace(-3,3,51)
- y1 = 2*x+2
- y2= x**2
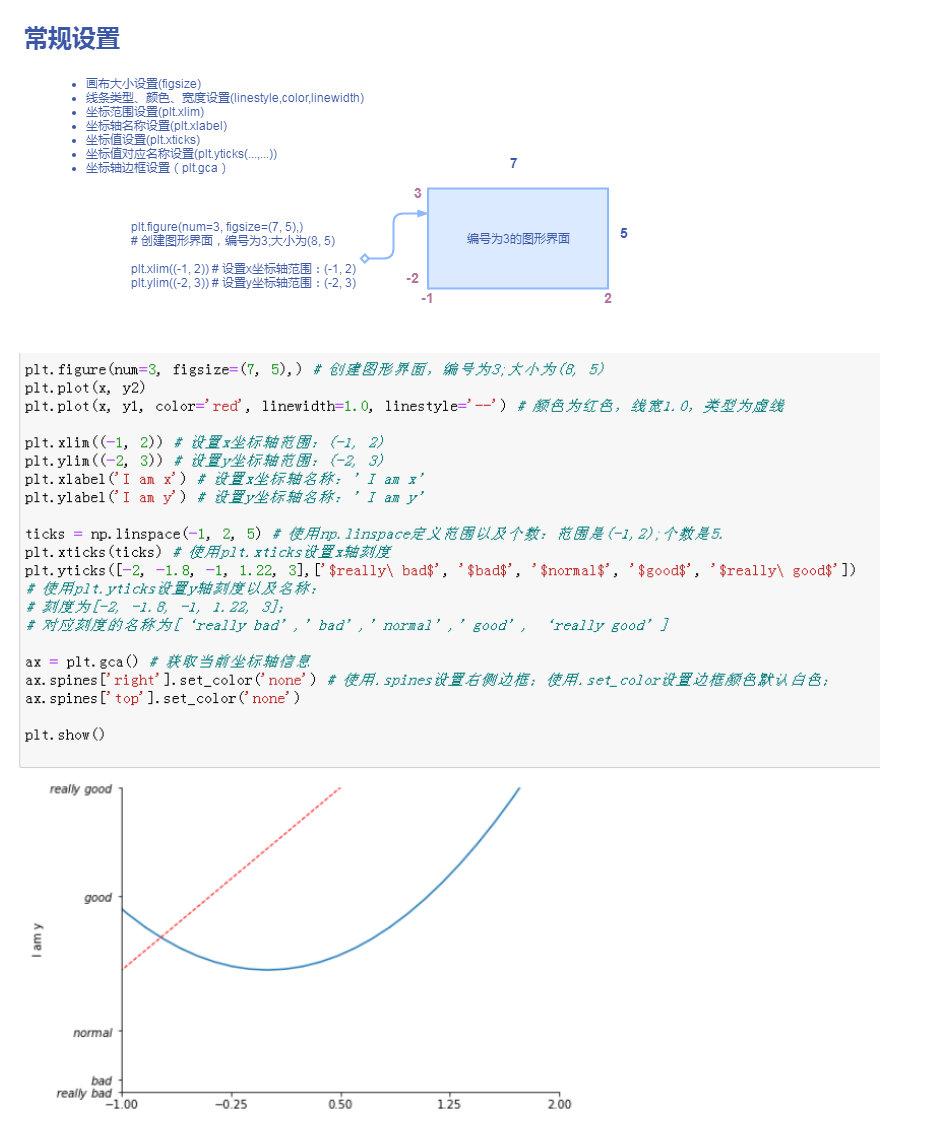
- plt.figure(num=3, figsize=(7, 5),) # 创建图形界面,编号为3;大小为(8, 5)
- plt.plot(x, y2)
- plt.plot(x, y1, color='red', linewidth=1.0, linestyle='--') # 颜色为红色,线宽1.0,类型为虚线
- plt.xlim((-1, 2)) # 设置x坐标轴范围:(-1, 2)
- plt.ylim((-2, 3)) # 设置y坐标轴范围:(-2, 3)
- plt.xlabel('I am x') # 设置x坐标轴名称:’I am x’
- plt.ylabel('I am y') # 设置y坐标轴名称:’I am y’
- ticks = np.linspace(-1, 2, 5) # 使用np.linspace定义范围以及个数:范围是(-1,2);个数是5.
- plt.xticks(ticks) # 使用plt.xticks设置x轴刻度
- plt.yticks([-2, -1.8, -1, 1.22, 3],['$really\ bad, '$bad, '$normal, '$good, '$really\ good])
- # 使用plt.yticks设置y轴刻度以及名称:
- # 刻度为[-2, -1.8, -1, 1.22, 3];
- # 对应刻度的名称为[‘really bad’,’bad’,’normal’,’good’, ‘really good’]
- ax = plt.gca() # 获取当前坐标轴信息
- ax.spines['right'].set_color('none') # 使用.spines设置右侧边框;使用.set_color设置边框颜色默认白色;
- ax.spines['top'].set_color('none')
- plt.show()

|
|
 ( 粤ICP备18085999号-1 | 粤公网安备 44051102000585号)