鱼C论坛

 找回密码
 立即注册
查看: 1201|回复: 3

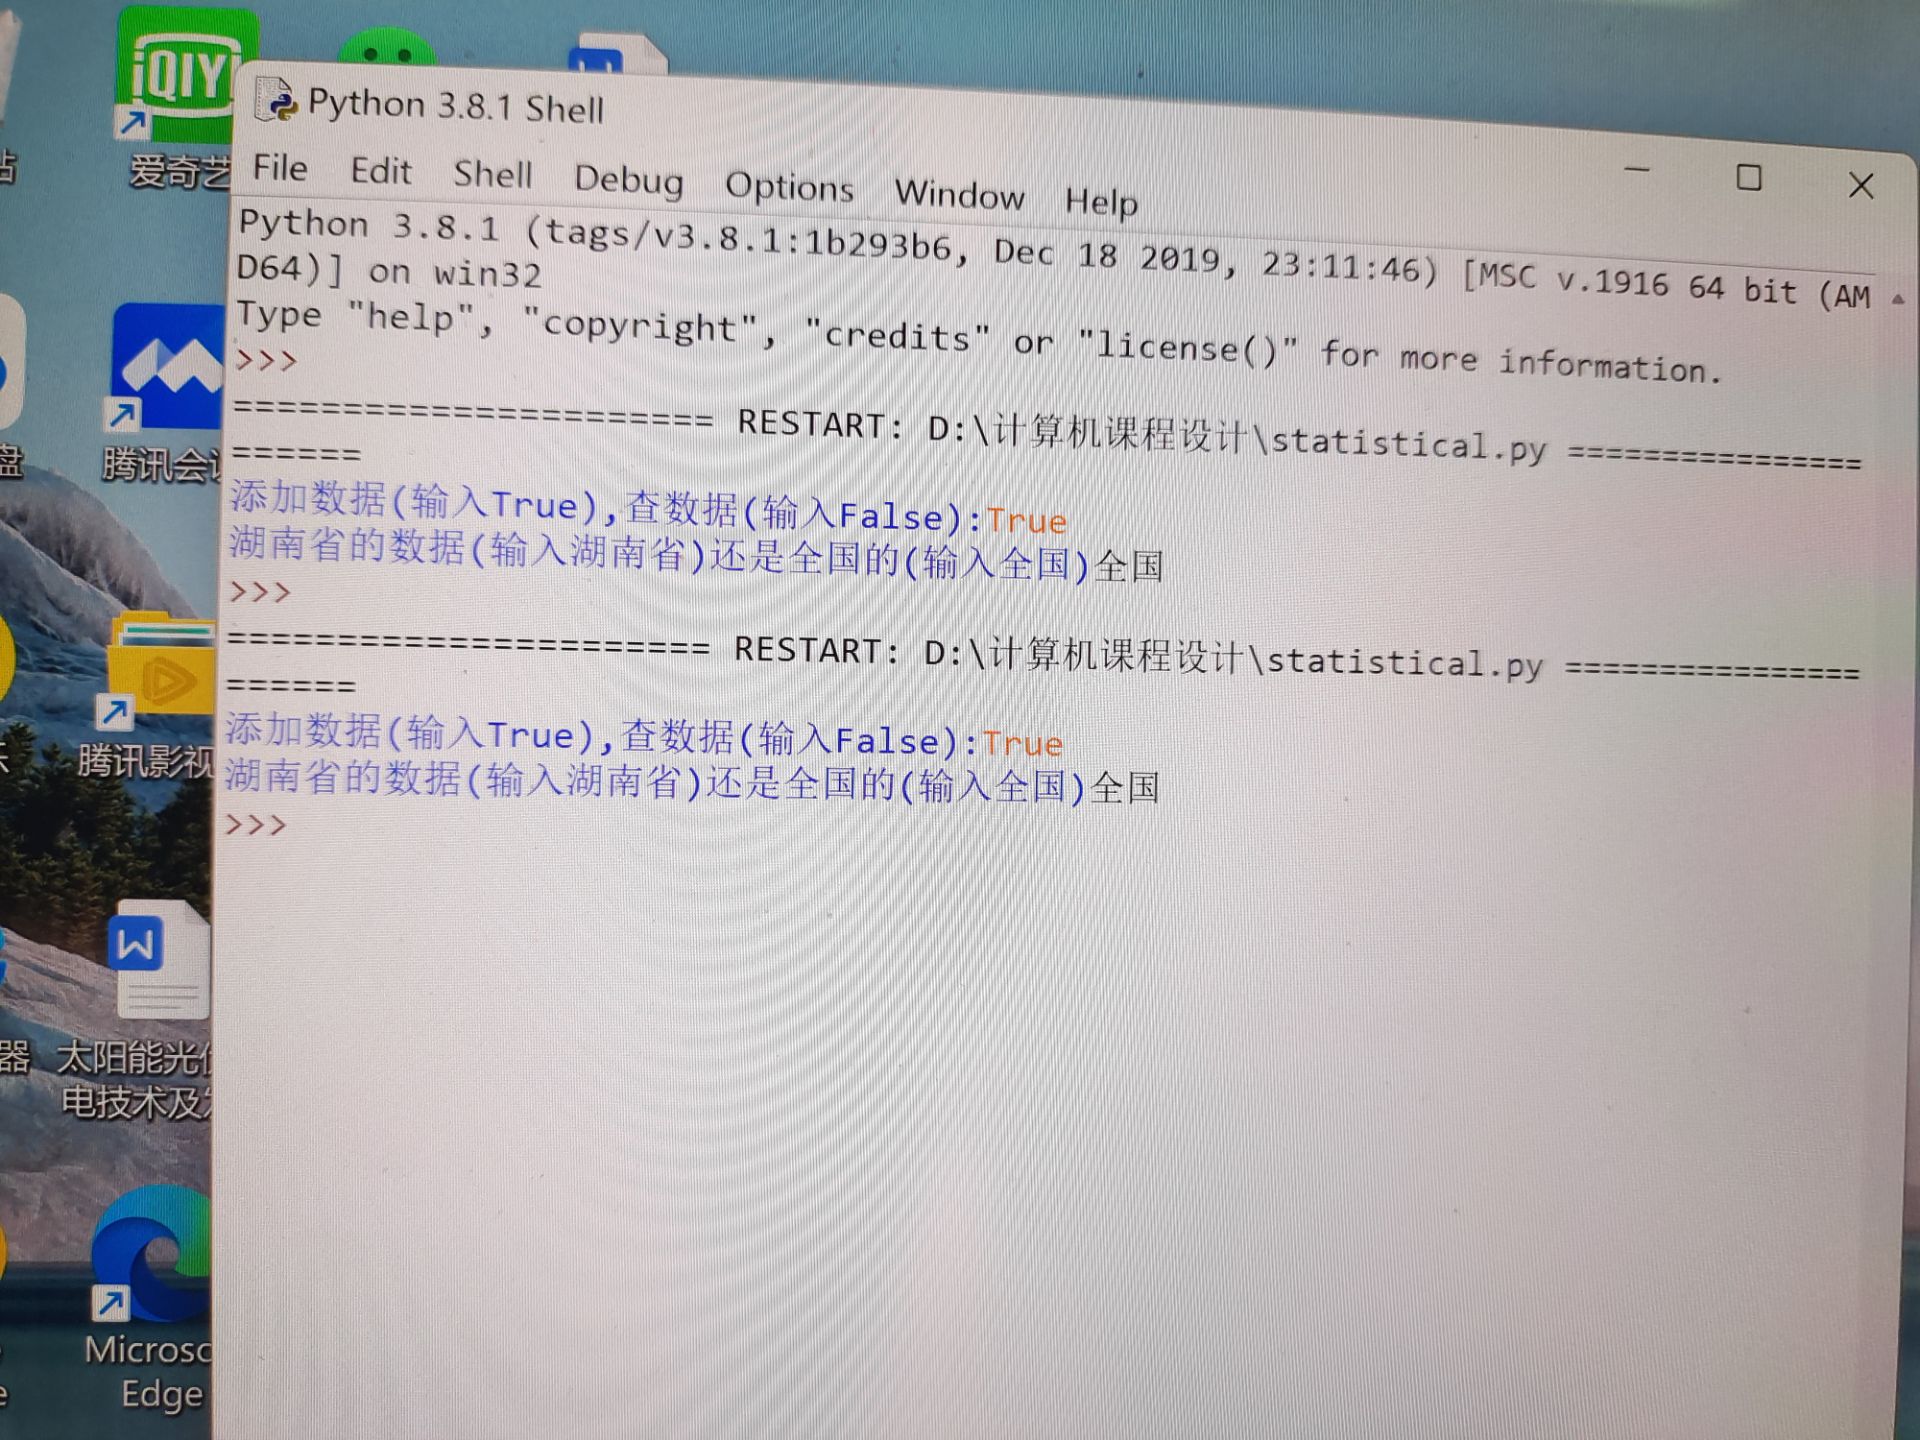
[已解决]各位大佬帮我看看,我的哪里错了,为什么画不出图?

[复制链接]
发表于 2022-5-14 00:04:47 | 显示全部楼层 |阅读模式

马上注册,结交更多好友,享用更多功能^_^

您需要 登录 才可以下载或查看,没有账号?立即注册

x
  1. import matplotlib.pyplot as plt
  2. import numpy as np
  3. import seaborn as sns
  4. import warnings
  5. def make(x,y):
  6.     warnings.filterwarnings("ignore")

  7.     plt.figure(figsize=(10,5))
  8.     plt.plot(x,y)
  9.     plt.title('电量统计图')
  10.     plt.xlabel('Year')
  11.     plt.ylabel('亿千瓦时')
  12.     plt.show()


  13. def list1():
  14.     add = eval(input("请输入要添加的数据(格式一个年份一个发电量以字典的形式输入):"))
  15.     add = list(add.items())
  16.     add.sort(key = lambda x:x[0],reverse=False)
  17.     return add


  18. a = input('添加数据(输入True),查数据(输入False):')
  19. b = input("湖南省的数据(输入湖南省)还是全国的(输入全国)")
  20. y1 = [62758.2,67914.2,71422.1,74170.4,81121.8]
  21. x1 = [2017,2018,2019,2020,2021]
  22. y2 = [1349.2,1418.8,1505.5,1496.2,1658.6]
  23. x2 = [2017,2018,2019,2020,2021]


  24. if a == True and b ==  "全国":
  25.     list1 = list1()
  26.     for x,y in list1:
  27.         y1.append(y)
  28.         x1.append(x)
  29.     while True:
  30.         del x1[0]
  31.         del y1[0]
  32.         if len(x1) == 5:
  33.             break
  34.     make(x1,y1)
  35.         
  36. if a == True and b == "湖南省":
  37.     list1 = list1()
  38.     for x,y in list1:
  39.         y2.append(y)
  40.         x2.append(x)
  41.     while True:
  42.         del x2[0]
  43.         del y2[0]
  44.         if len(x2) == 5:
  45.             break
  46.     make(x2,y2)
  47. if a == False and b == "全国":
  48.     make(x1,y1)

  49. if a == False and b == "湖南省":
  50.     make(x2,y2)
复制代码
7163FD1C34B81E08024B3D41251EB63A.jpg
最佳答案
2022-5-14 00:04:48

你第一个 input 返回的是 “True” 字符串,而不是 True 布尔值

所以你应该在后续的 if a == True 或 if a == False 都改成 if a =="True" / if a == "False"

参考代码:
  1. import matplotlib.pyplot as plt
  2. import numpy as np
  3. import seaborn as sns
  4. import warnings


  5. def make(x, y):
  6.     warnings.filterwarnings("ignore")

  7.     plt.figure(figsize=(10, 5))
  8.     plt.plot(x, y)
  9.     plt.title('电量统计图')
  10.     plt.xlabel('Year')
  11.     plt.ylabel('亿千瓦时')
  12.     plt.show()


  13. def list1():
  14.     add = eval(input("请输入要添加的数据(格式一个年份一个发电量以字典的形式输入):"))
  15.     add = list(add.items())
  16.     add.sort(key=lambda x: x[0], reverse=False)
  17.     return add


  18. a = input('添加数据(输入True),查数据(输入False):')
  19. b = input("湖南省的数据(输入湖南省)还是全国的(输入全国)")
  20. y1 = [62758.2, 67914.2, 71422.1, 74170.4, 81121.8]
  21. x1 = [2017, 2018, 2019, 2020, 2021]
  22. y2 = [1349.2, 1418.8, 1505.5, 1496.2, 1658.6]
  23. x2 = [2017, 2018, 2019, 2020, 2021]

  24. if a == "True" and b == "全国":
  25.     list1 = list1()
  26.     for x, y in list1:
  27.         y1.append(y)
  28.         x1.append(x)
  29.     while True:
  30.         del x1[0]
  31.         del y1[0]
  32.         if len(x1) == 5:
  33.             break
  34.     make(x1, y1)

  35. if a == "True" and b == "湖南省":
  36.     list1 = list1()
  37.     for x, y in list1:
  38.         y2.append(y)
  39.         x2.append(x)
  40.     while True:
  41.         del x2[0]
  42.         del y2[0]
  43.         if len(x2) == 5:
  44.             break
  45.     make(x2, y2)
  46. if a == "False" and b == "全国":
  47.     make(x1, y1)

  48. if a == "False" and b == "湖南省":
  49.     make(x2, y2)
复制代码
想知道小甲鱼最近在做啥?请访问 -> ilovefishc.com
回复

使用道具 举报

发表于 2022-5-14 00:04:48 | 显示全部楼层    本楼为最佳答案   

你第一个 input 返回的是 “True” 字符串,而不是 True 布尔值

所以你应该在后续的 if a == True 或 if a == False 都改成 if a =="True" / if a == "False"

参考代码:
  1. import matplotlib.pyplot as plt
  2. import numpy as np
  3. import seaborn as sns
  4. import warnings


  5. def make(x, y):
  6.     warnings.filterwarnings("ignore")

  7.     plt.figure(figsize=(10, 5))
  8.     plt.plot(x, y)
  9.     plt.title('电量统计图')
  10.     plt.xlabel('Year')
  11.     plt.ylabel('亿千瓦时')
  12.     plt.show()


  13. def list1():
  14.     add = eval(input("请输入要添加的数据(格式一个年份一个发电量以字典的形式输入):"))
  15.     add = list(add.items())
  16.     add.sort(key=lambda x: x[0], reverse=False)
  17.     return add


  18. a = input('添加数据(输入True),查数据(输入False):')
  19. b = input("湖南省的数据(输入湖南省)还是全国的(输入全国)")
  20. y1 = [62758.2, 67914.2, 71422.1, 74170.4, 81121.8]
  21. x1 = [2017, 2018, 2019, 2020, 2021]
  22. y2 = [1349.2, 1418.8, 1505.5, 1496.2, 1658.6]
  23. x2 = [2017, 2018, 2019, 2020, 2021]

  24. if a == "True" and b == "全国":
  25.     list1 = list1()
  26.     for x, y in list1:
  27.         y1.append(y)
  28.         x1.append(x)
  29.     while True:
  30.         del x1[0]
  31.         del y1[0]
  32.         if len(x1) == 5:
  33.             break
  34.     make(x1, y1)

  35. if a == "True" and b == "湖南省":
  36.     list1 = list1()
  37.     for x, y in list1:
  38.         y2.append(y)
  39.         x2.append(x)
  40.     while True:
  41.         del x2[0]
  42.         del y2[0]
  43.         if len(x2) == 5:
  44.             break
  45.     make(x2, y2)
  46. if a == "False" and b == "全国":
  47.     make(x1, y1)

  48. if a == "False" and b == "湖南省":
  49.     make(x2, y2)
复制代码
想知道小甲鱼最近在做啥?请访问 -> ilovefishc.com
回复

使用道具 举报

 楼主| 发表于 2022-5-14 10:05:04 | 显示全部楼层
本帖最后由 风百默 于 2022-5-14 10:06 编辑
Twilight6 发表于 2022-5-14 08:49
你第一个 input 返回的是 “True” 字符串,而不是 True 布尔值

所以你应该在后续的 if a == True 或  ...


大佬这个标题的汉字显示不出来,但x轴的英文字母可以显示,这是为什么,还有执行这个程序的时候电脑就会卡一会, -356cd62d5a2a5c56.jpg
想知道小甲鱼最近在做啥?请访问 -> ilovefishc.com
回复

使用道具 举报

发表于 2022-5-14 10:28:24 | 显示全部楼层
风百默 发表于 2022-5-14 10:05
大佬这个标题的汉字显示不出来,但x轴的英文字母可以显示,这是为什么,还有执行这个程序的时候电脑就 ...


添加这行代码,设置支持中文的字体:plt.rcParams['font.sans-serif'] = ['SIMHEI']

想知道小甲鱼最近在做啥?请访问 -> ilovefishc.com
回复

使用道具 举报

您需要登录后才可以回帖 登录 | 立即注册

本版积分规则

小黑屋|手机版|Archiver|鱼C工作室 ( 粤ICP备18085999号-1 | 粤公网安备 44051102000585号)

GMT+8, 2024-4-20 00:00

Powered by Discuz! X3.4

© 2001-2023 Discuz! Team.

快速回复 返回顶部 返回列表