|
|
马上注册,结交更多好友,享用更多功能^_^
您需要 登录 才可以下载或查看,没有账号?立即注册
x
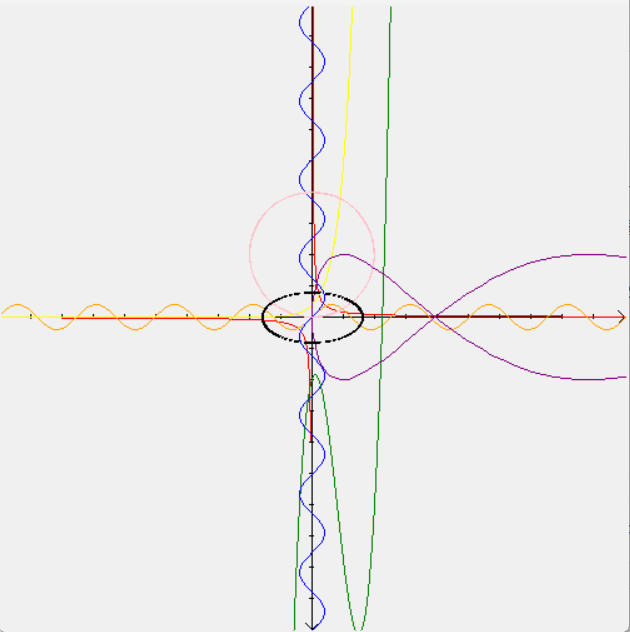
作为tkinter.Canvas的练习,我做了这个画图小程序。
主要功能:绘制函数图像(显函数,隐函数,参数方程,直角坐标系,极坐标系)注意,所画函数在定义区间内必须连续!
canvas大小:500*500,坐标范围x,y∈[-50,50],精度0.1.
解释:
1.直角坐标系显函数:draw_graphic_explicit(exp,st_x,en_x,color)
exp:lambda表达式,所画图像为 y=exp(x)
st_x,en_x:定义区间D=[st_x,en_x]
color:图像颜色
应用:一般函数
2.直角坐标系参数方程:draw_graphic_argequation(exp_x,exp_y,st_t,en_t,color)
exp:同上,所画图像为{x=exp_x(t),y=exp_y(t)}
st_t,en_t,color:同上
应用:反函数等
3.极坐标系显函数:draw_graphic_explicit_polarcoord(exp,st_f,en_f,color)
exp:同上,所画图像为 ρ=exp(φ)
st_t,en_t,color:同上
应用:快速画出直角坐标系中的隐函数,如圆,椭圆
4.直角坐标系隐函数:draw_graphic_implicit(exp_x_y,rect_x1,rect_y1,rect_x2,rect_y2,color)
exp_x_y:所画图像为 exp_x_y(x,y)=0
画出 rect 矩形范围内所有符合条件的点。(矩形左上角与右下角坐标分别为(rect_x1,rect_y1),(rect_x2,rect_y2))
color:同上
应用:低效画出直角坐标系内的隐函数。唯一的优点:隐函数解析式不受限制
- import tkinter as tk
- import math
- window=tk.Tk()
- canvas=tk.Canvas(window,width=500,height=500)
- canvas.pack()
- def _range(a,b,step):
- c=a+step
- _list=[round(a,5)]
- while c+step<b:
- _list.append(round(c,5))
- c+=step
- return _list
- def create_line_easy(coord_x1,coord_y1,coord_x2,coord_y2,color):
- canvas.create_line(coord_x1*10+250,250-coord_y1*10,coord_x2*10+250,250-coord_y2*10,fill=color)
- def draw_axis():
- canvas.create_line(0,250,500,250)
- canvas.create_line(250,0,250,500)
- canvas.create_line(495,245,500,250,495,255)
- canvas.create_line(245,495,250,500,255,495)
- for i in range(-500,500,25):
- canvas.create_line(248,i,252,i)
- canvas.create_line(i,248,i,252)
- draw_axis()
- def draw_graphic_explicit(exp,st_x,en_x,color): # 平面直角坐标系显函数
- for i in _range(st_x,en_x,0.1):
- create_line_easy(i,exp(i),i+0.1,exp(i+0.1),color)
-
- def draw_graphic_argequation(exp_x,exp_y,st_t,en_t,color): #平面直角坐标系参数方程
- for i in _range(st_t,en_t,0.1):
- create_line_easy(exp_x(i),exp_y(i),exp_x(i+0.1),exp_y(i+0.1),color)
-
- def draw_graphic_explicit_polarcoord(exp,st_f,en_f,color): #极坐标系显函数
- for i in _range(st_f,en_f,0.1):
- create_line_easy(math.cos(i)*exp(i),math.sin(i)*exp(i),math.cos(i+0.1)*exp(i+0.1),math.sin(i+0.1)*exp(i+0.1),color)
- def draw_graphic_implicit(exp_x_y,rect_x1,rect_y1,rect_x2,rect_y2,color): # 隐函数,低效小范围绘图不建议使用。[ exp_x_y(x,y)=0 ]
- for x in _range(rect_x1,rect_x2,0.1):
- for y in _range(rect_y1,rect_y2,0.1):
- if exp_x_y(x,y)<0.1 and exp_x_y(x,y)>-0.1:canvas.create_oval(x*10+250,250-y*10,x*10+250,250-y*10,fill=color)
- # main
- draw_graphic_explicit(lambda x:1/x,0.001,50,'red')
- draw_graphic_explicit(lambda x:1/x,-50,-0.001,'red')
- draw_graphic_explicit(lambda x:math.sin(x),-50,50,'orange')
- draw_graphic_explicit(lambda x:math.e**x,-50,50,'yellow')
- draw_graphic_explicit(lambda x:x*x*x-6*x*x+3*x-5,-50,50,'green')
- draw_graphic_argequation(lambda t:math.sin(t),lambda t:t,-50,50,'blue') # 相当于arcsin(x)
- draw_graphic_argequation(lambda t:t*t,lambda t:5*math.sin(t),-10,10,'purple')
- draw_graphic_explicit_polarcoord(lambda f:math.sin(f)*10,-math.pi,math.pi,'pink') #相当于x**2+(y-5)**2=10(圆)
- draw_graphic_implicit(lambda x,y:x*x+y*y-2,-5,-5,5,5,'black')

|
|
 ( 粤ICP备18085999号-1 | 粤公网安备 44051102000585号)